Where is the AI Bubble Right Now Compared to the 2000 Dot-Com Bubble?
An elaborate, dual-timeline comparison overlaying the 1995–2003 Dot-Com cycle directly onto the 2022–2030 AI revolution. Why we are in 1997–1998, what the two future paths look like, and why this won't crash like 2000.
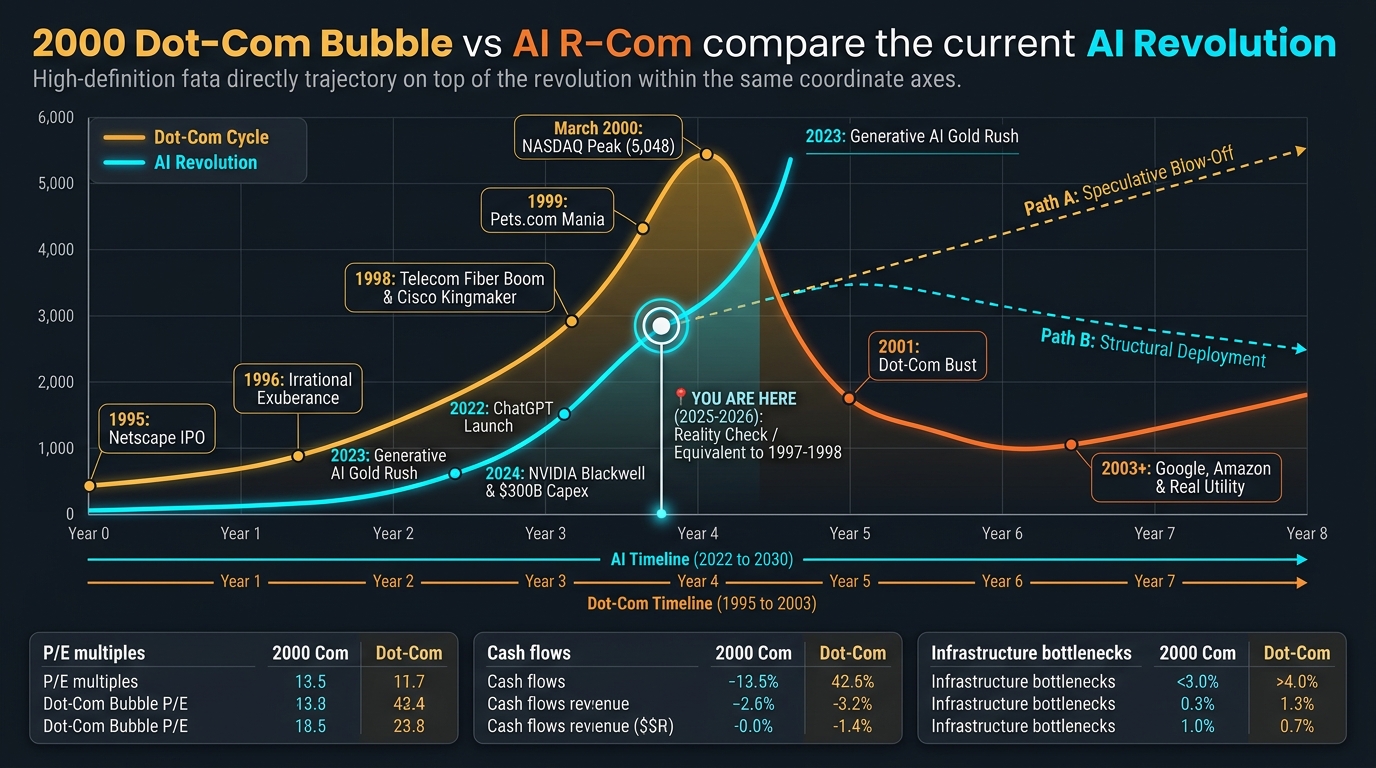
Vector Overlaid Graph (Interactive)
Direct Alignment Reading: Year 3.5 of the Cycle
When aligned to the same catalyst starting point (1995 Netscape vs 2022 ChatGPT), AI in 2025–2026 is at the exact position the internet was in 1997–1998. Hardware infrastructure has been built, the easy excitement has passed, and investors are demanding real software revenues ($600B Sequoia question) before any speculative 1999-style blow-off can occur.
1. The 5 Phases: Step-by-Step Historical Alignment
By overlaying the two cycles on a normalized timeline, we can observe the direct parallels at each distinct stage:
2. Head-to-Head Architectural & Economic Metrics
Examining the underlying mechanics demonstrates why today's AI environment cannot experience a 2000-style catastrophic bankruptcy:
| Economic Metric | 2000 Dot-Com Bubble | 2025–2026 AI Era | Structural Impact |
|---|---|---|---|
| Valuation Multiples | NASDAQ P/E reached 175x – 200x (Cisco 130x, Yahoo 400x). | Mag-7 trade at 25x – 35x forward earnings (Nvidia ~35x). | Today's valuations are backed by explosive real GAAP earnings, not speculative paper hopes. |
| Capital Financing Source | High-yield junk bonds & speculative pre-revenue retail IPOs. | Mega-cap operating cash flow (>$500B annual FCF across Big Tech). | Even if AI generated $0 revenue, Microsoft, Alphabet, and Meta cannot go bankrupt. |
| Physical Bottleneck | Laying optical fiber (cheap permits, unlimited dark glass). | Gigawatts of power, nuclear PPAs & substation transformers. | Physical grid limits prevent unconstrained speculative overbuild from running wild. |
| Distribution Friction | Required purchasing PCs, modems, and dial-up lines (took 7 yrs for 50% US homes). | Instantaneous web & API distribution to billions of existing smartphones. | User adoption is 10x faster, but token cost means marginal serving cost isn't zero. |
| Marginal Cost to Serve | Effectively $0 per pageview (static HTML/CSS on web servers). | Non-zero token compute (FLOPS, memory bandwidth, electricity per prompt). | Forces startups to find genuine high-value enterprise workflows to sustain margins. |
| Failure Mode / Downside | Corporate bankruptcy and total equity wipeout (WorldCom, Global Crossing, Pets.com). | Accelerated GPU depreciation write-downs & thin-wrapper acqui-hires. | A margin compression cycle rather than a systemic banking or solvency collapse. |
3. The Fork in the Road: Path A vs. Path B
On the graph, look at the two dashed projection lines branching from the 📍 YOU ARE HERE pin:
Path A: The Speculative Blow-Off
If Wall Street ignores the current revenue gap and launches a new speculative wave (sovereign AI nation-state spending, unconstrained venture rounds, retail FOMO), the market could push into a blow-off euphoria peak around 2027 before an aggressive cyclical correction.
Path B: The Structural Deployment Plateau
Big Tech absorbs the capex from existing cash cows, token costs collapse by 90% via inference optimizations and custom ASICs (Google TPU, AWS Trainium), and AI transitions directly into quiet, high-margin enterprise deployment (automated coding, financial auditing, biomedical discovery).
The Engineer's Conclusion: Whether the market follows Path A or Path B, the winning engineering strategy remains identical: stop building shallow prompt wrappers, and start engineering deep, deterministic, high-throughput systems that integrate AI reasoning directly into mission-critical workflows.